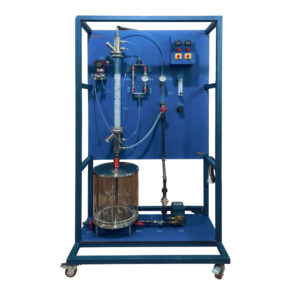
A crucial unit activity in the treatment of water is depth filtration. This procedure can be demonstrated using ICT-3298. Pumped from above into a filter is raw water that has been tainted with particulates. As the untreated water passes through the filter bed, the particles are caught and kept. At the bottom of the filter, the water itself emerges after passing through the filter bed. Filtrate, the treated water, pours into a tank.
The filter bed’s flow resistance rises as more and more solids are deposited there over time. The growing pressure loss between the filter’s input and output makes this process visible. Reduced flow passes through the filter. The filter bed is cleaned and the pressure loss is once more reduced by backwashing with treated water. There is a differential pressure gauge on the filter. Along the filter bed, there are numerous pressure-measuring locations. Hoses are used to transport the pressures to tube manometers, which are shown as water columns. Plotting Micheau diagrams is possible using this. Measurements are made of the flow rate, temperature, differential pressure, and system pressure.
The filter bed’s flow velocity can be changed. All pertinent points can be used to collect samples. On a scale, the height of the filter bed may be read. The operating states can be controlled and data can be measured by a software application. The measured data and the individual component’s current operational states are displayed in a process diagram. The raw water can be created, for instance, using diatomite.