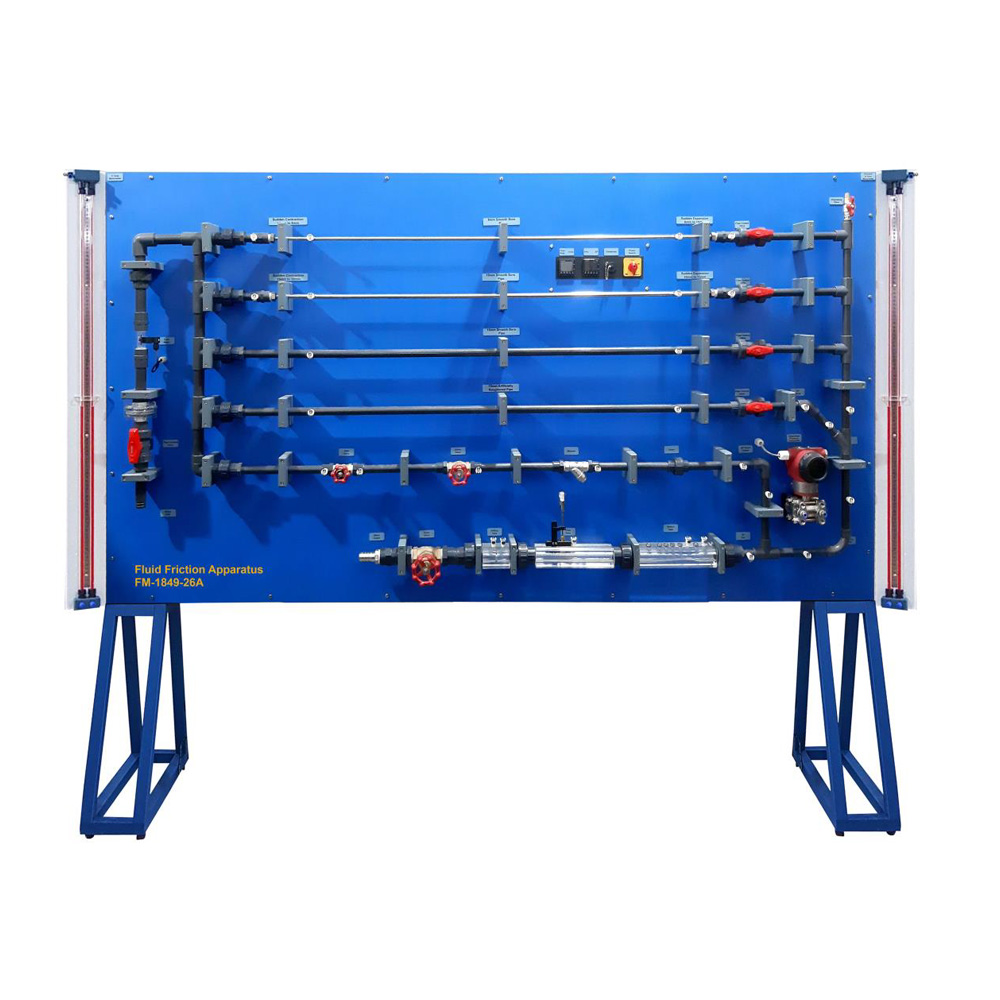
This apparatus is designed to allow the detailed study of the fluid friction head losses which occur when an incompressible fluid flows through pipes, bends, valves and pipe flow metering devices. Friction head losses in straight pipes of different sizes can be investigated over a range of Reynolds’ numbers from 103 to nearly 5000, there by covering the laminar, transitional and turbulent flow regimes in smooth pipes. In addition, an artificially roughened pipe is supplied which, at the higher Reynolds’ numbers, shows a clear departure from the typical smooth bore pipe characteristics. Pipe friction is one of the classic laboratory experiments and has always found a place in the practical teaching of fluid mechanics. The results and underlying principles are of the greatest importance to engineers in the aeronautical, civil, mechanical, marine, agricultural and hydraulic fields. Osborne Reynolds distinguished between laminar and turbulent flow in pipes in his publication in 1883. Ludwig Prandtl, Thomas Stanton and Paul Blasius later analyzed pipe flow data in the early part of this century and produced the plot known as the Stanton diagram. John Nikuradse extended the work to cover the case of rough pipes and one such pipe supplied with this equipment has been roughened for flow comparison purposes. In addition to the equipment for the study of losses in straight pipes, a wide range of accessories is available including pipe fittings and control valves, a venturi tube, pitot tube and an orifice plate assembly.
Experiments
- Laminar to turbulent flow regimes
- Energy Losses in Pipes fittings and Bends
- Rugosity
- Flow Measurement using venture meter
- Flow measurement using Orifice Plate
- Use of Pitot Static Tube
- Use of Manometers
The ratio of the diameter of the pipe to the distance of the pressure tapping from the ends of each pipe has been selected to minimize end and entry effects. A system of isolating valves in provided whereby the pipe to be tested can be selected without disconnecting or draining the system. The arrangement allows tests to be conducted on parallel pipe configurations. Ported manometer connecting valves ensure rapid bleeding of all interconnecting pipe work.
Each pressure tapping is fitted with an automatic shut off plug. Quick coupling socket attachments with an adequate quantity of translucent polythene tubing are provided, so that any pair of pressure toppings can be rapidly connected to one of the two manometers supplied. These are a mercury manometer and a pressurized water manometer.