Pumps are used in almost all aspects of industry and engineering from feeds to reactors and distillation columns in chemical engineering to pumping storm water in civil and environmental.
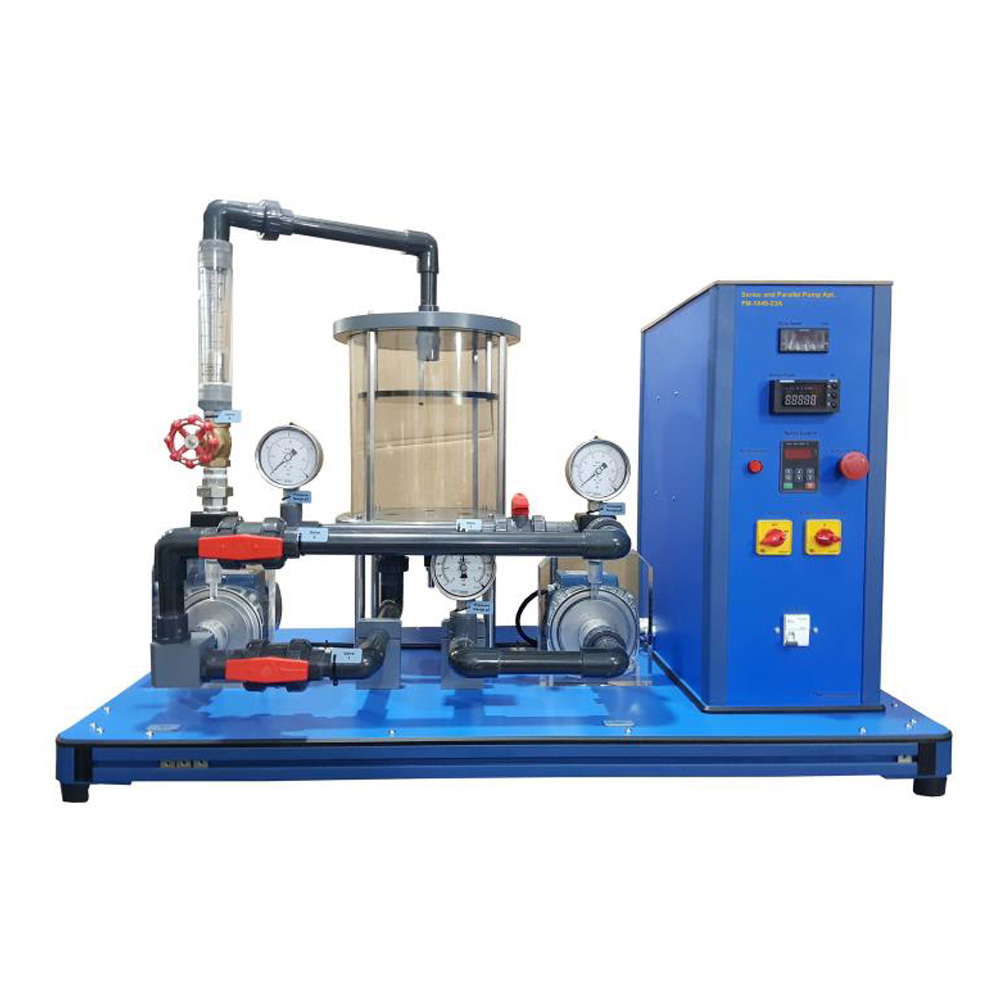
They are an integral part of engineering and an understanding of how they work is important. Centrifugal pump is one of the most widely used pumps for transferring liquids. This is for a number of reasons. Centrifugal pumps are very quiet in comparison to other pumps. They have a relatively low operating and maintenance costs. Centrifugal pumps take up little floor space and create an uniform and non-pulsating flow. The Serial & Parallel Pump apparatus is specially designed to demonstrate to students the operating characteristics of centrifugal pump in series, parallel or single pump operation. This training unit operates in close loop. This equipment will explore the relationship between pressure head and flow rate of a single pump sand of two identical pumps that run in series or in parallel and cavitation Phenomena in centrifugal pump.
When identical pumps run in series, the pressure head is approximately doubled but the flow rate remains the same. When pumps are run in parallel the flow is increased but the pressure head produced is approximately the same as a single pump.
This equipment also allows the study of efficiency of a pump. The energy in this experiment is put through two transformations. First, the electrical energy, which is the energy put into the system, is transferred to mechanical energy, which is the energy required to move the shaft and impeller, the rotation of the impeller can easily be seen through transparent construction of pump casing. Second, the mechanical energy is transferred into energy of the fluid. This is
accomplished through the pump rotation, which transfers the velocity energy of the water to pressure energy. The overall efficiency is the product of the mechanical (shaft) efficiency and the thermodynamics efficiency.
Experiments
- To demonstrate the basic operation and characteristic of centrifugal pumps.
- To differentiate the performance curve of a single pump and of two identical pumps that runin series or in parallel.
- Pump characteristic curves for centrifugal pumps.
- Determination of the capacity of pumps.
- Single pump operation.
- Determination of pump efficiency.
- Determination of total head, pump output, overall efficiency of centrifugal pump in series or in parallel.
- Two plot curves between head vs. discharge, pump efficiency vs. discharge, pump output vs. discharge.
- Understanding the Cavitation Phenomena in centrifugal pump.
Specifications
Pumps
- Two units of Horizontal Single Stage Centrifugal transparent Pump (P1) and (P2).
- Max. Flow rate: Upto 100L/min
- Max. Pump speed: 0-3000 rpm for pump 1 and 0-3000 for pump 2.
- Parallel pumping both pumps 3 phase variable speed.
- Max. Head of single pump is 10m to 12m
Circulation Tank
- A transparent plexiglass water tank is provided to supply water to P1 and P2.
- Flowrate and pump head, speed and power indicators.
- All indicators are displayed in its respective engineering unit. No conversion is required.
Selector switch
The selector switch allows the selection of system operates either with 1 pump or 2 pumps (series/parallel).
Pressure/Speed/Flow Indicator
Equipped with measurement gauge/sensor for head pressure flow rate, speed using.
With 3 manometers attached at inlet middle and outlet.
Pressure Gauge
Range: 0 to 2.5bar (Qty. 2)
Range: -1bar to 1bar (Qty. 1)
Process piping
The process piping is made of industrial PVC pipes.Valves used are nonferrous to minimize rust and corrosion. Valves and interconnecting pipe work all mounted on a stainless-steel base.
Requirements
Electrical: 220/380 VAC, 3-phase, 50/60Hz
Water: Laboratory main supply
Software FM-1849-23A SW (optional)
The user-friendly DAQ Software NITM is specifically designed in the NITM Lab VIEWTM environment. It provides a comprehensive solution for data acquisition, processing, and reporting on Windows system. The software empowers users to precisely measure and calculate values, aggregate data into a table graphs, and image. Ultimately, it generates a
comprehensive CSV report that includes all measured and calculated data, including graphs.
Scope of Delivery
1 experimental module
1 instruction manual